Automatic classification of LiDAR data
Author: Rohith Maben - Last update: 2023-11-17
Introduction
CANUPO is a software tool for classifying 3D terrestrial lidar data of complex natural scenes. It works by analyzing the shape and arrangement of the points in the point cloud data. Based on their unique geometrical properties, the tool can identify different features in the data, such as the rocks, vegetation, and ground. This tool is handy for archaeologists who need to analyze large datasets of lidar scans to identify and map archaeological features in the landscape. By using CANUPO, you can automate the classification process and save time and effort in analyzing the data.
The classifier is trained using a machine-learning approach that can handle large point cloud datasets. Once the classifier is constructed, it can automatically classify new point cloud data. The user can remove points with uncertain classification results.
In the previous tutorial, a subsection of the dataset was manually classified as ground or not ground. (class 1 and class 2). The following tutorial allows for automatically classifying point cloud data using the CANUPO plugin.
1. Load the dataset for training:
Load the LIDAR data via File-> Open-> Cloud. laz The loaded data can be manipulated using the techniques described in tutorial 3.3.1
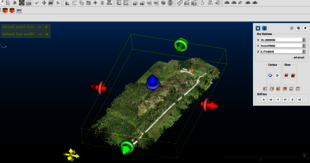
After the segmentation and merge process, two sets of point clouds generated will be used for the automatic classification. It is essential to ensure a similar number of points in both subsets.
2. Training a classifier:
Go to the Plugins menu from the top dropdown menu. Plugins > CANUPO > CANUPO Training
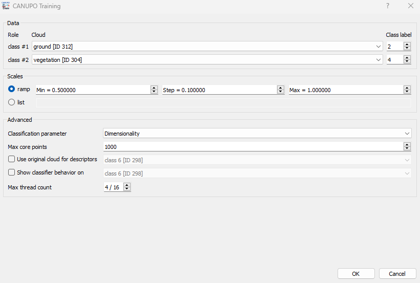
Revise the Data dropdown menus to match your subsampled clouds. In this tutorial, class 1 is set to the off-ground cloud points, and class 2 is set to the ground cloud points.
Optionally, you can set more advanced parameters in the lower part of the dialog box:
• Descriptors that will be computed (only "Dimensionality."
• The maximum number of core points that will be randomly extracted from the input cloud (10000-20000)
you can specify to use the original cloud to compute the descriptors (More accurate results) else you can specify another cloud that will be used to display the classifier behaviour.
Once ready, click the "OK" button to start the training. The plugin will begin to compute each cloud's descriptors and then try to find the best classification boundary.
Some information about how scales work:
Multi-scale descriptors help to identify different objects or surfaces in a natural environment by analysing their shape and structure at varying levels of detail. The number of scales used in the analysis is a classification parameter that the user can adjust to optimize the classification process for a specific application or dataset. The point cloud data is analyzed within each sphere by computing the local dimensionality of the point cloud around each point.
The local dimensionality characterizes the 3D organization of the point cloud within the sphere. It varies from 1D (points set along a line) and 2D (points forming a plane) to the total 3D volume. The local cloud geometry can be monitored across different scales by changing the sphere's diameter. This multi-scale analysis helps capture the scene's geometric features at varying levels of detail, which can be used to distinguish between different classes of objects or surfaces.
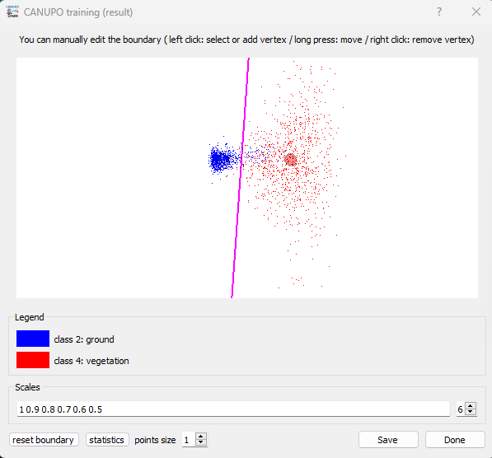
The classifier behavior is represented by projecting all the descriptors in the classification space with the classification boundary in between (as a magenta line). If a custom cloud has been set to display the classifier behavior, all its descriptors will be represented in grey. Otherwise, the descriptors corresponding to the first class will be shown in blue and the others in red. The results tab also show the number of points that are falsely classified and the accuracy of the classification. If the results are satisfactory, go ahead and save the classifier (.prm).
3. Classify the cloud dataset:
Go to the Plugins menu for the top dropdown menu. Plugins >> CANUPO >> CANUPO Classify. Navigate to your saved .prm file and make sure the cloud you want to classify is selected.
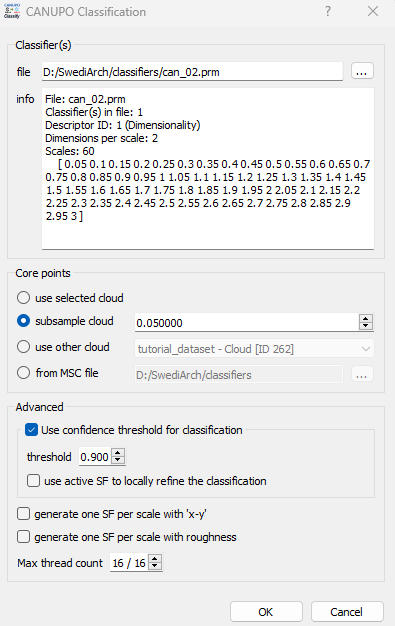
Next, the 'core points' on which the computation should be done are selected. Selecting a subsample of the original cloud would help reduce the computation time. The classification result for a given core point is propagated to its nearest neighbors. Therefore, using core points instead of the whole cloud would provide a less accurate result. Select the confidence threshold level for the classification and the thread counts based on the available computation resources.
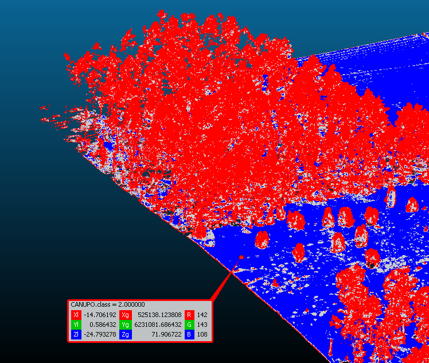
Once the .prm file is loaded and the cloud dataset is selected, the classification is now complete. Set the view to the CANUPO class in the properties tab to view the newly classified points. You can now set the class number (1,2) to visualize the classified data.
5. Postprocess the classification results:
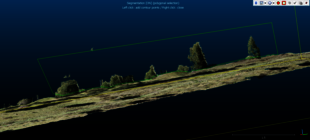
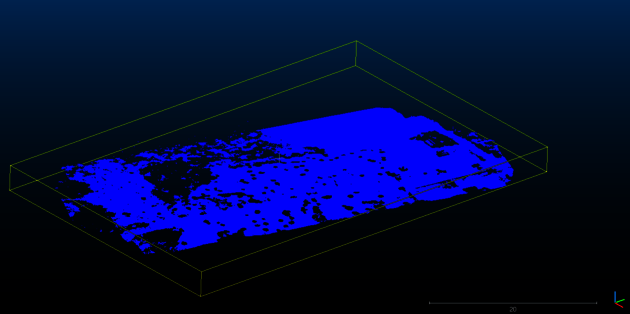
To make a digital terrain model (DTM), or digital elevation model (DEM), we need ground points separated from vegetation points.
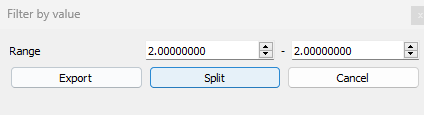
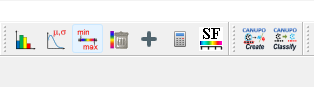
Use the Min-max tool to export the points outside the selected range; in this case, we only want to view the ground.
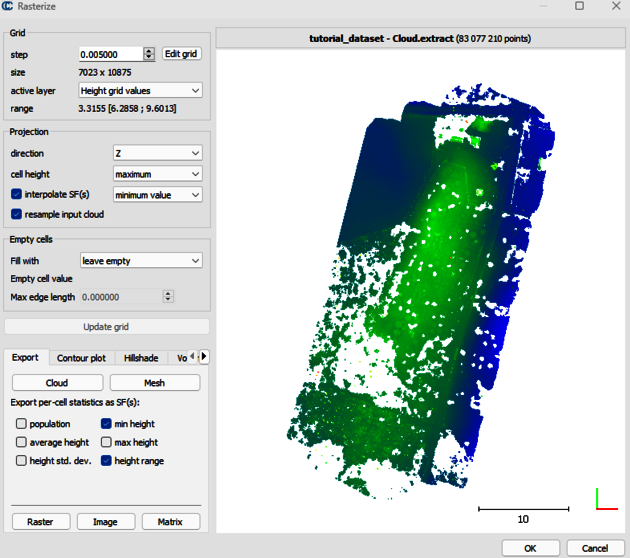
Next under tools select:
Tools-> Projections-> Rasterize. Define the cell size for the rendering, e.g., 0.1 (smaller values will increase time for computation). Select the Z for the direction of projection. Click “Update Grid” and you will see a preview.
Reference:
[1]https://www.cloudcompare.org/doc/wiki/index.php/CANUPO_(plugin)
[2] Brodu, N. (2013), CANUPO: Tagging 3D point clouds of natural scenes, Retrieved from https://nicolas.brodu.net/en/recherche/canupo/