
Multi-hazard assessment of UNESCO World Heritage Sites in Sweden
Author: Jan Haas - Last update: 2026-08-13
Citation:
Haas, J. (2026, June 24). Multi-hazard assessment of UNESCO World Heritage Sites in Sweden. Zenodo. https://doi.org/10.5281/zenodo.20830351
Introduction
Cultural heritage sites provide important insights into human history, culture, and the relationship between societies and their environment. UNESCO World Heritage Sites are recognized as places of Outstanding Universal Value and are considered significant not only to individual countries but also to humanity as a whole. Sweden hosts a diverse range of World Heritage Sites, including historic towns, industrial landscapes, archaeological remains, religious monuments, and natural environments. Preserving these sites for future generations is an important task that requires an understanding of both human and environmental pressures. Environmental hazards such as flooding, landslides, erosion, and sea-level rise can threaten the integrity and long-term preservation of cultural heritage. Many of these hazards are expected to become more frequent or severe as a consequence of climate change. Identifying which heritage sites may be exposed to such hazards is therefore an important step in supporting conservation efforts, climate adaptation strategies, and sustainable spatial planning.
Geographical Information Systems (GIS) provide powerful tools for integrating, visualizing, and analysing spatial information from multiple sources. Through the combination of cultural heritage data and environmental hazard datasets, GIS can be used to identify potentially exposed sites, investigate spatial patterns, and support evidence-based decision-making. The increasing availability of open geospatial data and open-source software has made such analyses accessible to a wide range of users, including students, researchers, planners, and heritage managers. This tutorial introduces the principles of multi-hazard assessment through a practical exercise focusing on UNESCO World Heritage Sites in Sweden. Using open geospatial datasets and the open-source software QGIS, you will explore and visualize cultural heritage and hazard data, perform spatial analyses, and assess the exposure of World Heritage Sites to pluvial flooding, fluvial flooding, coastal flooding, and landslide hazards.
The tutorial demonstrates how simple spatial overlay techniques can be used to identify sites that are potentially exposed to one or several hazards and how the results can be summarized into a multi-hazard exposure indicator. Beyond the technical workflow, the exercise also introduces important concepts related to hazard assessment, including the distinction between exposure and risk, the influence of data quality and uncertainty, and the opportunities and limitations of GIS-based analyses. While the assessment presented in this tutorial represents a simplified screening approach, the methods and concepts provide a foundation for more advanced analyses of cultural heritage vulnerability, climate change impacts, and disaster risk reduction. Although the focus is on Swedish World Heritage Sites, the workflow can easily be adapted to other cultural heritage assets and environmental hazards in different parts of the world.
Tutorial
This tutorial will consecutively guide you through the steps that are required to obtain software, download hazard and exposure data, visualize the layers and quantify the exposure of UNESCO World Heritage Sites in Sweden to fluvial flood, pluvial flood risk, sea level rise and landslide and rockfall risk. The tutorial relies fully on open data and open-source software.
1. QGIS download and installation
Go to https://qgis.org/download/ and get the latest version of QGIS (4.x.x) that fits your operating system. Open the installer and follow the installation procedure. For help with the installation and introduction to the software, consult the QGIS documentation.
2. Download World Heritage sites data from the Swedish National Heritage Board
Download open World Heritage sites data from the Swedish National Heritage Board (Riksantikvarieämbetet). Go to the Riksantivarieämbetets open data portal and get informed about the datasets that are available and choose the dataset you are interested in. In this tutorial we interested in World Heritage Sites in Sweden (Världsarv i Sverige). Expand Världsarv i Sverige, and download Världsarv i Sverige (Nedladdning) as geopackage. Geopackages have replaced the traditional shapefile in many contexts.
3. Visualize the data in QGIS
Open QGIS. In the Browser window to the left, open the XYZ Tiles folder and drag and drop the OpenStreetMap background on the map. Then browse to the folder where you saved your geopackage, expand the package and drag the varldsarv_sverige_polygon layer onto the map. Your setup could look like the example in Figure 1.
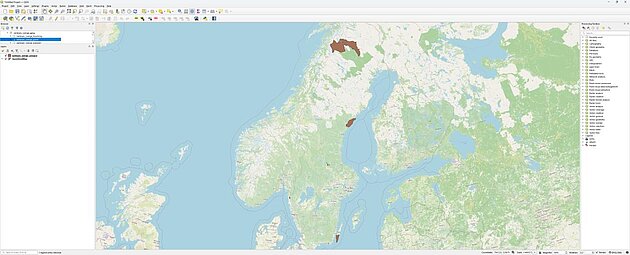
Explore the contents of the downloaded data by right clicking the varldsarv_sverige_polygon layer and then choosing Open Attribute Table. Double clicking on the line number to the left zooms in
on the object on the map. Save your project from time to time. Now that we have explored the data, it is time to get all relevant hazard data.
4. Hazard data description
For this exercise, four data layers have been prepared and made available that describe different hazards: pluvial flood hazard, fluvial flood hazard, coastal flood hazard and landslide and rock fall hazard. Download the hazard data layers for this exercise from the following Zenodo repository.
4.1 Pluvial flood data
Torrential rain is expected to occur more frequently and with greater intensity as the climate changes. Work on local torrential rain mapping in Sweden began a few years ago, but there is still no nationwide dataset. The torrential rain maps in this exercise were produced by municipalities and County Administrative Boards (Länsstyrelser). The primary data source is the County Administrative Board’s geodata catalogue, where most depression maps are available at the county level. In addition to depression mapping, cloudburst mapping is also provided to some extent. However, the County Administrative Boards have no overarching responsibility for ensuring that cloudburst mapping is carried out. Some counties that had not made their maps available were contacted directly to gain access to depression mapping data. The same applies to cloudburst mapping, which is often conducted only over larger urban areas, as such mapping is complex and requires significant data and expertise. Consequently, municipalities frequently engage external consultants to carry out cloudburst mapping. By requesting access to cloudburst and depression maps, a comprehensive database was established. Comprehensive in the sense that the analysis includes at least one cloudburst or depression map for each municipality. In some cases, particularly for densely populated areas, both types of maps are included. Since both cloudburst or depression maps vary significantly in terms of methodology, water levels, spatial resolutions, whether the modeling pertains to the current or a future climate, the date of implementation, and the data included in the maps, it is a challenge to create homogeneous hazard areas.
4.2 Fluvial and coastal flood data
All datasets representing risks of river flooding were obtained from the the Swedish Civil Defence and Resilience Agency (MCF), formerly known as The Swedish Civil Contingencies Agency (MSB) through the Flood Portal. Individual datasets were combined to create comprehensive datasets. The extent of the flooding was determined based on a 100-year flood event (areas that, statistically speaking, are flooded once every 100 years). Information on inundation depth is often included in the models. For the MSB’s flood mapping for watercourses dataset, it is only known whether the area is flooded or not without any depth.
These areas have a water depth of zero in the model. The following flood models from the Flood Portal were included:
- MSB’s flood mapping for watercourses
- Hazard and risk maps in accordance with the Flood Risk Directive
- Flood mapping for Lake Mälaren
- Flood mapping for the Göta River
- Flood mapping for the Torne River
- Coastal flood models based on sea level rise from 1 to 5 meters
4.3 Landslides and rock fall data
Open data from MCF, the Swedish Geotechnical Institute (SGI) and the Swedish Forest Agency (Skogsstyrelsen) has been used as a basis for assessing exposure to landslides and rockfalls. MCFs general stability map is available in two different datasets that complement each other and were therefore combined into a single layer for this exercise. The mappings were conducted after 2001 within limited areas that are built-up and where conditions for landslides exist. The general stability map of fine-grained soils, which is available at the municipal level, includes mappings from 51 municipalities that are missing from the general stability map. Areas classified as stability zone 1 (high proportion of clay, silt/sand, and silt/sand on clay) and stability zone 2 (lower proportion of silt/sand, silt/sand on clay, and clay) are included in the dataset. Within stability zone 1, conditions exist for initial spontaneous or induced landslides and rockfalls. Within stability zone 2, conditions for initial landslides or rockfalls are absent, but the zone may be affected by landslides and rockfalls initiated within the adjacent stability zone 1. SGI’s datasets pertain to landslide risk mapping along the Göta river, the Norsälven river, and the Säveån river. Landslide risk areas along watercourses with probability classes 4 and 5 are considered to pose a high risk. The Landslide and Rock Fall Impact Area dataset, compiled by the Swedish Forest Agency, broadly identifies areas that may be prone to erosion, landslides, and/or debris flows. These areas may be sensitive to impacts on vegetation as well as changes in water volume, flow paths, and flow rates—that is, impacts that often arise from forestry and development.
5. Hazard data exploration and visualization
Extract the hazards.zip file into your working folder. The file contains four hazard surfaces in vector format (CoastalFlood; FluvialFlood; Landslides; PluvialFlood). Add the layers to the map. Adjust the drawing order and visualization similar to the example in Figure 2 by right clicking the layer in the Browser > Properties and by editing in the Symbology section. Further reference on how to change a layer’s appearance is found in the QGIS documentation and in related Swedigarch exercises.
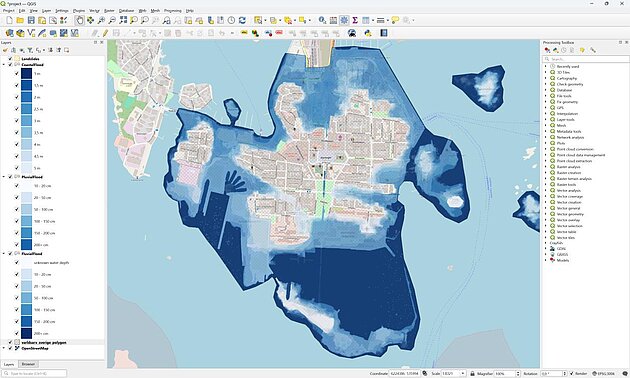
To visualize the correct information, we need to know what column in the attribute table contains the correct values. The following table summarizes the flood layers’ information and explains the numerical values.
Layer | Column name | Unit | explanation |
CoastalFlood | Vattendjup | m | Flooded area under sea level rise scenario. Numbers indicate the sea level rise in meters. |
PluvialFlood | DN | cm | Inundation depth: 20 = 10 - 20 cm 50 = 20 - 50 cm 100 = 50 - 100 cm 150 = 100 - 150 cm 200 = 150 - 200 cm 201 = 200+ cm |
FluvialFlood | gridcode | cm | Inundation depth: 0 = unknown inundation depth20 = 10 - 20 cm 50 = 20 - 50 cm 100 = 50 - 100 cm 150 = 100- 150 cm 200 = 150 - 200 cm 201 = 200+ cm |
We can directly observe that some hazard layers overlap World Heritage sites. We will now find out which ones. To do that we add this information as new attributes to the World Heritage site layer. Right click on the varldsarv_sverige_polygon layer and choose Open Attribute Table to add five fields to the layer according to Table 2. First make the table editable by Toggeling edit mode. Then click the New field symbol. The last layer will be an aggregate indication of individual hazards. Save your changes and close the attribute table.
Add Field Name | Add Field Type |
Landslide | Integer 32bit) |
Coastal Flood | Integer (32bit) |
Pluvial Flood | Integer (32bit) |
Fluvial Flood | Integer (32bit) |
Exposure to Hazard | Integer (32bit) |
Fixing geometries
The geometries of spatial layers sometimes suffer from inconsistencies, e.g. polygons that do not exactly close or line features that have dangles or are too short. To ensure that spatial operations run smoothly, the geometries must not contain errors. This is a general recommendation when working with geodata from different sources. In our case we need to fix the geometries of the CoastalFlood and the FluvialFlood layers. In the Processing Toolbox to the right-hand side of the QGIS GUI search for ‘fix geometry’. Choose the function Fix geometries under Vector geometry. Fix all geometries and save the vector files with the suffix ‘fixed’.
Analysing and quantifying exposure to multiple hazards
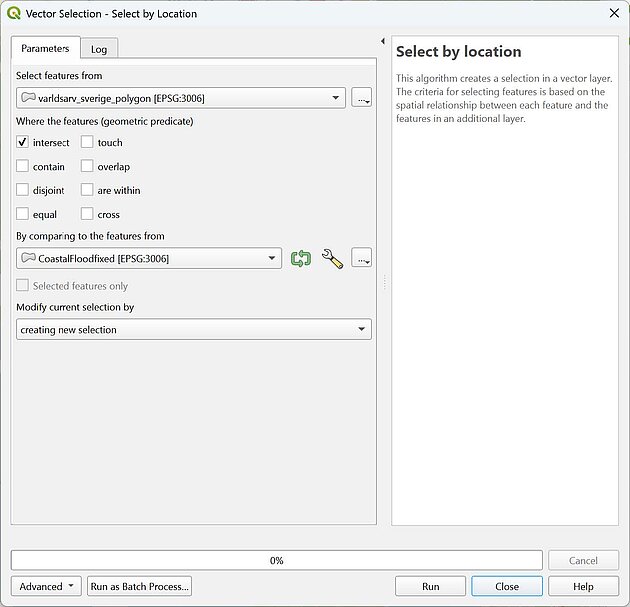
The newly added fields will contain the binary information on whether a feature in the list is affected by a hazard [1] or not [0]. To determine whether a heritage site is affected, we will perform queries based on spatial location. We run the Select by location algorithm ( ) using SQL. I all cases, we choose the varldsarv_sverige_polygon as input (Select features from). We choose the spatial relationship intersect under (Where the features) and finally, we select the layer to be compared to the layer containing the hazard (By comparing to the features from). We start with the CoastalFlood layer. Leave all other settings as shown in Figure 3.
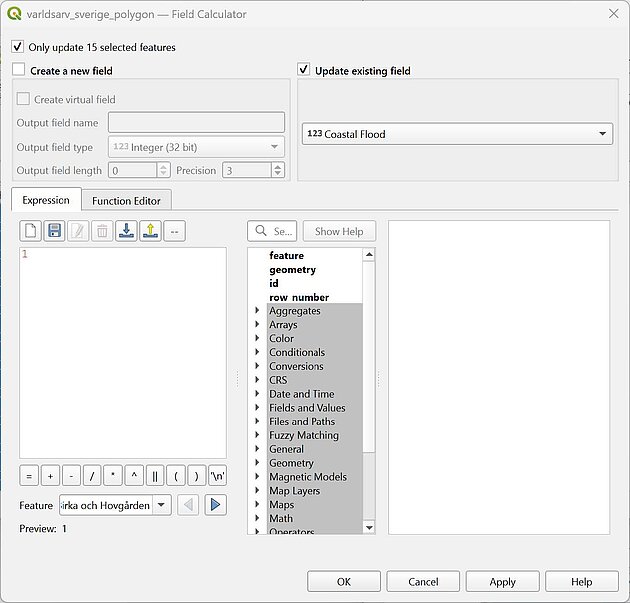
After the operation is complete, open the attribute table of varldsarv_sverige_polygon. In the lower left corner, choose Show selected features. The spatial query returned 15 out of 39 features. While having the sites selected, open the Field Calculator. Choose Update existing field and write ‘1’ in the Expression field and click Apply and OK as exemplified in Figure 4. If everything went right you now should see ‘1’ in the attribute table for 15 features under the Coastal Flood column.
Perform the same SQL analysis and update the table for all four hazards. The results are
Landslides = 5; Pluvial Flood = 24 and Fluvial Flood = 14.
Now we will identify to how many hazards in total each site is exposed. Open the Field Calculator again and populate the Exposure to hazards column by adding up all individual hazards by writing the following in the expression field.
“Fluvial Flood” + “Pluvial Flood” + “Landslide” + "Coastal Flood"The results show that one site is exposed to all four hazard types, 9 sites to 3 hazards, 10 sites to
2 hazards, 7 sites to 1 hazard and 12 sites are not exposed at all. Let’s visualise this in a map.
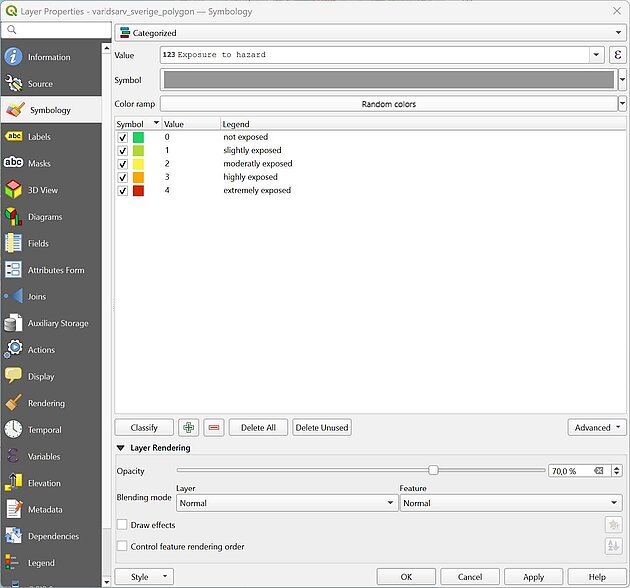
Save all edits and discontinue editing mode by Toggeling edit mode. Right click on the varldsarv_sverige_polygon layer > Properties > Symbology tab and adjust to the example in Figure 5.
Discussion and Reflection
This straight-forward tutorial has demonstrated how open geospatial data and open-source GIS software can be used to conduct a national-scale multi-hazard assessment of UNESCO World Heritage Sites in Sweden. By combining cultural heritage data with hazard layers representing pluvial flooding, fluvial flooding, coastal flooding, and landslide and rockfall susceptibility, it was possible to identify sites that are potentially exposed to one or several environmental hazards. The workflow illustrates how GIS can support cultural heritage management, climate adaptation, spatial planning, and disaster risk reduction through the integration of spatial datasets from multiple sources. At the same time, the exercise highlights several important limitations that should be considered when interpreting the results and designing future analyses. The assessment presented here should therefore be regarded as a first screening exercise intended to identify potentially exposed sites rather than a complete risk assessment.
One of the most important considerations is the distinction between exposure and risk. The analysis identifies whether a heritage site spatially overlaps with a hazard area, but exposure alone does not determine the actual level of risk. Risk is generally understood as a combination of hazard, exposure, and vulnerability. While two heritage sites may be exposed to the same hazard, the consequences may differ considerably depending on the characteristics of the site. A medieval stone church, for example, may respond very differently to flooding than a historic wooden settlement. Likewise, a cultural landscape that depends on specific ecological conditions may be more vulnerable to drought and changing climatic conditions than a built heritage site. Factors such as construction materials, age, maintenance status, ecological sensitivity, management practices, accessibility, and the cultural significance of individual elements all influence vulnerability. Consequently, a more comprehensive assessment would need to incorporate information about the sensitivity and adaptive capacity of individual sites rather than focusing solely on spatial overlap with hazard zones.
The selection of hazards included in this tutorial also deserves reflection. The analysis focuses on four hazards that are particularly relevant within a Swedish context, but these represent only a subset of the environmental threats that may affect cultural heritage. Other hazards such as wildfires, storms, droughts, coastal erosion, ground subsidence, freeze-thaw processes, heat waves, and long-term ecosystem change may also pose significant threats to cultural heritage assets. Climate change is expected to alter both the frequency and intensity of many environmental hazards, potentially creating new challenges for heritage conservation. Future assessments could therefore broaden the scope of analysis by incorporating additional hazard datasets and by evaluating how changing climatic conditions may influence heritage sites over longer time horizons.
The quality and consistency of the underlying data constitute another important source of uncertainty. The hazard datasets used in this exercise originate from different organizations, have been produced using different methodologies, and often vary in terms of spatial resolution, temporal coverage, modelling assumptions, and intended application. This is particularly evident for pluvial flood datasets, where mapping approaches differ substantially between municipalities and regions. Such differences can affect the comparability of results and introduce uncertainties that are not immediately visible in the final maps. Hazard boundaries may appear precise, yet they often represent simplified model outputs that contain significant uncertainty. Furthermore, some datasets describe current conditions while others may represent future scenarios or historical assessments. Understanding the origin, quality, and limitations of spatial data is therefore a critical component of any GIS-based risk analysis. Decision-makers should always interpret results within the context of these uncertainties and avoid treating hazard maps as exact representations of future events.
Scale also plays an important role in determining how results should be interpreted. The national perspective adopted in this tutorial is useful for identifying broad spatial patterns and highlighting sites that may warrant further investigation. However, environmental hazards often operate at much finer spatial scales than those represented in national datasets. Within an individual World Heritage site, hazard exposure may vary considerably depending on local topography, land cover, drainage conditions, building characteristics, and infrastructure. A site classified as exposed at the national level may in reality contain only small areas affected by a particular hazard, while local conditions may create vulnerabilities that are not captured by regional hazard maps. Consequently, national-scale assessments should be viewed as complementary to more detailed local investigations rather than as substitutes for them. Follow-up studies could utilize high-resolution elevation models, local hydraulic simulations, detailed inventories of heritage assets, and site-specific environmental information to obtain a more nuanced understanding of risk.
The methodology used in this tutorial intentionally prioritizes simplicity and transparency. The binary classification of hazards as either present or absent allows analysts to focus on the fundamental principles of spatial analysis without becoming overwhelmed by technical complexity. Nevertheless, this approach inevitably simplifies reality. Hazard intensity, probability, duration, and spatial extent are not explicitly considered. A heritage site that intersects a small area of shallow flooding is treated in the same manner as a site affected by extensive and deep inundation. More advanced approaches could therefore incorporate hazard intensity measures such as flood depth, landslide probability, erosion rates, or projected sea-level rise. Likewise, instead of using a simple binary classification, future analyses could quantify the proportion of each site affected by different hazards. Such approaches would provide a more detailed representation of exposure and enable comparisons between sites with different levels of hazard severity.
Another promising development would involve the use of weighted multi-criteria analysis. Not all hazards necessarily pose the same level of threat to cultural heritage, and different stakeholders may prioritize risks differently. Multi-criteria approaches allow hazard layers, vulnerability indicators, and management priorities to be combined into a single decision-support framework. Similarly, raster-based analyses could replace simple vector overlays and allow continuous hazard surfaces to be integrated with other environmental variables. Such methods are widely used in environmental modelling and can provide a more sophisticated representation of spatial risk patterns.
The interaction between hazards represents another important dimension that is not fully captured by the workflow presented here. The analysis assumes that hazards operate independently and simply counts the number of hazards affecting a site. In reality, hazards frequently interact with one another through compound and cascading processes. Heavy rainfall may simultaneously trigger pluvial flooding, river flooding, erosion, and landslides. Prolonged drought may increase wildfire risk, which in turn can alter vegetation cover and increase susceptibility to erosion and debris flows. Coastal flooding may damage protective infrastructure, thereby increasing vulnerability to future hazards. Such interactions can amplify impacts and create complex chains of consequences that are difficult to represent through simple additive exposure indices. Understanding these relationships is becoming increasingly important within climate adaptation research and disaster risk management, particularly as changing climatic conditions are expected to increase the occurrence of compound events.
A further limitation of the assessment is its largely static nature. The analysis represents a snapshot in time and does not explicitly consider the temporal dynamics of hazards. Environmental risks vary over time, both seasonally and over longer periods associated with climate change. Some hazards develop rapidly, such as cloudbursts and landslides, while others evolve gradually over decades, such as sea-level rise and ecosystem degradation. Future climate projections suggest that historical patterns may not provide a reliable guide to future conditions. Consequently, there is considerable value in integrating temporal perspectives into hazard assessments. Comparing present-day exposure with future climate scenarios could reveal emerging vulnerabilities and support long-term planning strategies. Historical analyses could also be used to investigate how hazard exposure has changed over time and how cultural heritage sites have responded to past environmental pressures.
Ultimately, the purpose of hazard assessments is not simply to identify areas of concern but to support informed decision-making and effective management. Once potentially exposed sites have been identified, heritage managers, planners, and policymakers must decide how best to allocate limited resources and implement adaptation measures. Depending on the nature of the hazard and the characteristics of the site, possible responses may include enhanced monitoring, improved drainage systems, flood protection measures, vegetation management, structural reinforcement, emergency preparedness planning, digital documentation, or targeted conservation interventions. Determining which measures are most appropriate requires balancing technical feasibility, economic considerations, cultural values, and long-term sustainability objectives.
The workflow presented in this tutorial can therefore be regarded as a starting point for more comprehensive analyses. Advances in geospatial technologies, remote sensing, climate modelling, digital twins, machine learning, and artificial intelligence offer significant opportunities for improving cultural heritage risk assessments in the future. High-resolution LiDAR data, satellite imagery, drone surveys, near-real-time monitoring systems, and predictive modelling approaches can provide more detailed and dynamic information about both hazards and heritage assets. As these technologies continue to evolve, GIS will play an increasingly important role in supporting the protection and sustainable management of cultural heritage under changing environmental conditions. This tutorial demonstrates not only how exposure assessments can be conducted using freely available data and software, but also why critical reflection on methodology, uncertainty, vulnerability, scale, and future change is essential for producing meaningful and actionable results.
Reference
Climate change adaptation
Climate change adaptation refers to actions that reduce vulnerability and increase resilience to current and future climate-related hazards. In the context of cultural heritage, adaptation measures may include flood protection, improved drainage, vegetation management, structural reinforcement, monitoring systems, and conservation planning designed to reduce future risks.
Coastal flooding
Coastal flooding occurs when seawater inundates normally dry land along the coast. In Sweden, coastal flooding is mainly caused by a combination of storm surges, high sea levels, strong winds, and, in the longer term, sea-level rise due to climate change. Low-lying coastal areas, ports, urban waterfronts, and river mouths are particularly vulnerable. The risks are generally highest along the southern and southwestern coasts, where land uplift is limited, while the northern Baltic coast benefits from ongoing post-glacial land uplift that partly offsets sea-level rise.
Compound and cascading risks
Compound risks occur when two or more hazards occur simultaneously or within a short time period, resulting in impacts that are greater than those produced by each hazard individually. Cascading risks occur when one hazard triggers additional hazards or secondary impacts. For example, extreme rainfall may simultaneously cause flooding and landslides, while flooding may damage infrastructure and increase future vulnerability.
Coordinate Reference System (CRS)
A Coordinate Reference System defines how geographic locations are represented on a map. It establishes the relationship between coordinates and positions on the Earth's surface. Using a consistent CRS is essential when combining datasets from multiple sources because mismatched coordinate systems can lead to inaccurate spatial analyses.
Cultural heritage
Cultural heritage refers to the tangible and intangible resources inherited from the past that are considered valuable for present and future generations. In the context of this tutorial, cultural heritage includes UNESCO World Heritage Sites, historic buildings, archaeological remains, cultural landscapes, and other sites of outstanding cultural or natural significance. Protecting cultural heritage involves understanding and managing threats from both human activities and environmental hazards.
Depression mapping
Depression mapping is a terrain analysis technique used in flood risk assessment to identify topographic depressions where water can accumulate during rainfall events. Using high-resolution Digital Elevation Models (DEMs), depressions are detected as areas that are lower than their surroundings and have limited or no natural drainage pathways. In flood risk analysis, depression mapping helps identify locations that are susceptible to surface water ponding and pluvial flooding, particularly during intense rainfall or cloudburst events. Key characteristics such as depression depth, area, storage volume, and connectivity to drainage networks can be quantified to estimate the likelihood and severity of flooding. Depression mapping is often combined with other terrain-based variables, such as slope, flow accumulation, land cover, and surface sealing, to improve flood susceptibility assessments and support urban planning, stormwater management, and climate adaptation strategies.
Exposure
Exposure describes the presence of people, infrastructure, ecosystems, cultural heritage assets, or other elements in areas that may be affected by hazards. In this tutorial, exposure is determined by identifying whether a UNESCO World Heritage Site spatially overlaps with one or more hazard zones. Exposure alone does not indicate the likelihood or severity of damage but represents an essential component of risk assessment.
Fluvial flooding
Fluvial flooding (river flooding) occurs when the water level in a river, stream, or watercourse exceeds the capacity of its channel and overflows onto adjacent land. It is typically caused by prolonged or intense rainfall, rapid snowmelt, ice jams, or a combination of these factors within a river catchment. Fluvial flooding can affect settlements, infrastructure, agricultural land, and natural ecosystems located within floodplains. The extent and severity of flooding depend on factors such as rainfall intensity, catchment size, soil saturation, land use, topography, and river channel characteristics. In flood risk analysis, fluvial flooding is commonly assessed using hydrological and hydraulic models that simulate river discharge, water levels, flow velocities, and inundation extents for events with different return periods (e.g., 10-, 100-, or 200-year floods). The resulting flood maps are widely used for spatial planning, infrastructure design, emergency management, and climate adaptation.
Geopackage (GPKG)
A Geopackage is an open, standards-based geospatial file format designed to store vector data, raster data, and associated attributes within a single file. It has become a modern alternative to the traditional shapefile format because it supports larger datasets, longer field names, and more complex data structures.
GeoTIFF
GeoTIFF is a widely used raster file format that combines standard TIFF image data with embedded geographic information. In addition to storing pixel values, a GeoTIFF contains metadata describing the coordinate reference system, map projection, geographic extent, and pixel resolution. This allows GIS and remote sensing software to automatically position the raster correctly in geographic space without requiring separate georeferencing files. GeoTIFF is commonly used for satellite imagery, aerial photographs, digital elevation models (DEMs), and environmental datasets.
Multi-hazard assessment
A multi-hazard assessment evaluates the potential impacts of multiple hazards within the same study area. Unlike single-hazard analyses, multi-hazard approaches acknowledge that sites may be affected by several environmental threats simultaneously or sequentially. Such assessments help identify locations where multiple hazards overlap and where management efforts may need to be prioritized.
Open data
Open data refers to information that is freely available for anyone to access, use, modify, and share with minimal restrictions. Open geospatial data provided by government agencies, research organizations, and international institutions plays a crucial role in supporting hazard assessments, environmental monitoring, and evidence-based decision-making.
Pluvial flooding
Pluvial flooding, also known as surface water flooding, occurs when intense rainfall exceeds the capacity of the ground, drainage systems, or sewer networks to absorb and convey water. As a result, water accumulates on the surface and flows across the landscape, causing flooding in urban and rural areas alike. Unlike fluvial flooding, which is caused by rivers overtopping their banks, or coastal flooding, which results from storm surges and high tides, pluvial flooding can occur anywhere, even in locations far from rivers and coastlines. Urban areas are particularly susceptible to pluvial flooding because impervious surfaces such as roads, buildings, and parking lots prevent rainwater from infiltrating into the soil. Water therefore rapidly accumulates in low-lying areas, topographic depressions, streets, and underpasses, potentially causing significant damage to buildings, infrastructure, and transportation networks. The frequency and severity of pluvial flooding are expected to increase in many regions as climate change leads to more frequent and intense rainfall events. Consequently, understanding and mapping pluvial flood risk has become an important component of urban planning, stormwater management, and climate adaptation strategies.
QGIS
QGIS (Quantum Geographic Information System) is a free and open-source Geographic Information System (GIS) software used for creating, managing, analyzing, and visualizing spatial data. It supports a wide range of vector, raster, and web-based geospatial data formats and provides powerful tools for cartography, spatial analysis, remote sensing, and geoprocessing. QGIS is widely used in academia, government agencies, and industry for applications such as environmental monitoring, urban planning, natural resource management, and disaster risk assessment. Its extensible plugin ecosystem and integration with programming languages such as Python make it a versatile platform for advanced geospatial workflows.
Risk
Risk is commonly defined as the combination of hazard, exposure, and vulnerability. It describes the potential for adverse consequences resulting from the interaction between hazardous events and vulnerable assets. While this tutorial focuses primarily on exposure, a complete risk assessment would also consider the likelihood of hazards occurring and the vulnerability of individual heritage sites.
Select by Location
Select by Location is a GIS operation that identifies features based on their spatial relationship to another dataset. Common spatial relationships include intersect, contain, touch, overlap, and within. In this tutorial, the operation is used to identify heritage sites that intersect hazard layers and therefore may be exposed to environmental hazards.
Spatial overlay analysis
Spatial overlay analysis is a GIS technique used to identify relationships between two or more spatial datasets by examining where they overlap geographically. In this tutorial, overlay analysis is used to determine which UNESCO World Heritage Sites intersect with hazard zones. Overlay operations are among the most fundamental analytical tools in GIS.
Spatial resolution
Spatial resolution describes the level of spatial detail represented in a dataset. For raster data, it corresponds to the size of individual pixels, while for vector data it relates to the level of detail captured by the geometries. Higher spatial resolution generally allows for more detailed analyses but often requires larger data volumes and greater computational resources.
Swedish National Heritage Board
The Swedish National Heritage Board (Swedish: Riksantikvarieämbetet) is the national government agency responsible for cultural heritage management and preservation in Sweden. The agency works to protect, manage, and promote Sweden's cultural heritage, including historic buildings, archaeological sites, cultural landscapes, museums, and archives. It also maintains national heritage databases and provides guidance, knowledge, and support to regional authorities, municipalities, researchers, and the public to ensure the sustainable conservation and use of cultural heritage resources.
UNESCO World Heritage Site
A UNESCO World Heritage Site is a cultural or natural site recognized by the United Nations Educational, Scientific and Cultural Organization (UNESCO) as possessing Outstanding Universal Value. These sites are considered important to humanity as a whole and are protected through international agreements and national conservation efforts.
Vector data
In GIS, vector data and raster data represent two fundamental models for storing and analyzing geographic information. Vector data represents discrete geographic features using points, lines, and polygons. Examples include buildings, roads, property boundaries, and administrative regions. Each feature can be linked to attribute information stored in a table, such as names, categories, or measurements. In contrast, raster data represents geographic phenomena as a grid of cells (pixels), where each cell contains a value. Raster data is commonly used for continuous surfaces such as elevation, temperature, land cover, or satellite imagery. Vector data is generally more suitable for representing clearly defined objects with precise boundaries, while raster data is better suited for continuous environmental variables and image-based analyses. Many GIS workflows combine both data types, for example by analyzing how land cover derived from raster imagery affects vector features such as properties, roads, or protected areas.
Vulnerability
Vulnerability refers to the susceptibility of an object, system, or site to suffer damage when exposed to a hazard. Vulnerability depends on factors such as construction materials, age, maintenance condition, ecological sensitivity, and adaptive capacity. In cultural heritage studies, vulnerability helps explain why two sites exposed to the same hazard may experience very different impacts.