
User-generated geodata for analysis and visualisation in QGIS
Author: Jan Haas - Last update: 2026-08-13
Citation:
Haas, J. (2026, June 24). User-generated geodata for analysis and visualisation in QGIS. Zenodo. https://doi.org/10.5281/zenodo.20830243
Introduction
Geographic Information Systems (GIS) are powerful tools for collecting, managing, analyzing, and visualising spatial data. While many GIS projects rely on existing datasets provided by mapping agencies, authorities, or researchers, it is often necessary to create new geodata to represent observations, measurements, or features that are not yet available in digital form. Examples include field observations, environmental measurements, archaeological findings, infrastructure inventories, or mapped land-use features.
This tutorial introduces the basic concepts and practical steps required to create your own geodata in QGIS, one of the world's most widely used open-source GIS software packages. The tutorial focuses on three common types of user-generated geodata: vector data, raster data, and tabular data containing geographic coordinates. You will learn how to create point, line, and polygon features within QGIS, how to generate and import raster data using the ASCII raster format, and how to import coordinate-based observations from CSV files.
The tutorial also introduces fundamental geospatial concepts such as coordinate reference systems, vector and raster data models, and common geospatial data formats. Throughout the exercises, the Swedish national coordinate reference system SWEREF99 TM (EPSG:3006) is used, although the same principles can be applied to other coordinate systems and regions.
After completing this tutorial, you will be able to create your own spatial datasets, manage their attributes, and prepare them for further analysis and visualisation in QGIS. These skills form an important foundation for many GIS applications in fields such as environmental science, archaeology, urban planning, natural resource management, surveying, and disaster risk assessment.
Tutorial
This tutorial provides a practical introduction to creating, importing, and managing geospatial data in QGIS. The exercises will guide you through the process of generating your own vector data, creating and importing raster data, and importing tabular data containing geographic coordinates. In addition, the tutorial introduces common geospatial data formats and coordinate reference systems that are frequently used in GIS applications. The tutorial is divided into three main parts. First, you will create point, line, and polygon vector layers and add your own features through digitisation. Second, you will create and import raster data using the ASCII raster format and convert it to a more commonly used GIS raster format. Finally, you will create and import a .csv file containing coordinate-based observations and visualise these data as point features in QGIS. The exercises rely entirely on open-source software and user-generated data. By completing the tutorial, you will gain practical experience with fundamental GIS workflows that form the basis for more advanced spatial analysis, modelling, and visualisation tasks.
1. QGIS download and installation
Go to qgis.org/download/ and get the latest version of QGIS (4.x.x) that fits your operating system. Open the installer and follow the installation procedure. For help with the installation and introduction to the software, consult the QGIS documentation.
2. Create vector data in QGIS
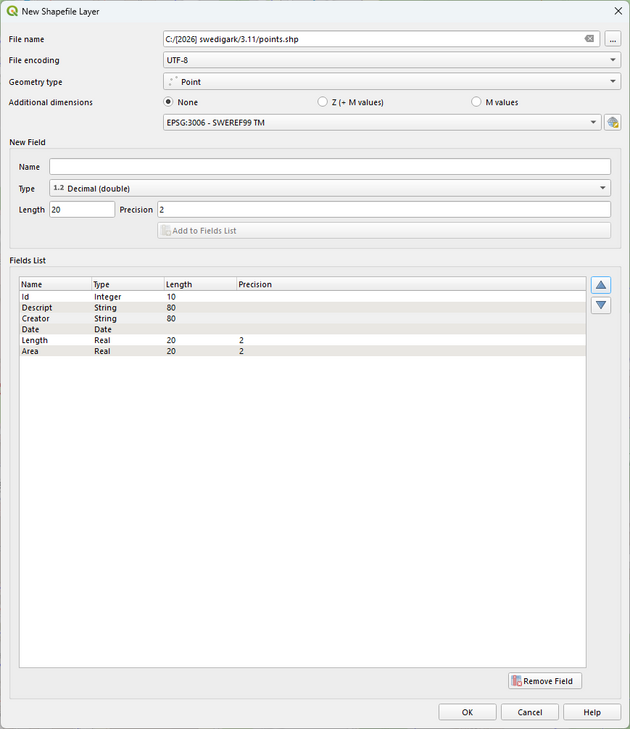
Create a project folder on your system, e.g. in the Windows Explorer. Open QGIS. In the Browser window to the left, open the XYZ Tiles folder and drag and drop the OpenStreetMap background on the map. Zoom to a place of your interest in Sweden. In the Browser window, right click on your working folder and select New > Shapefile. Create three shapefiles - one for Point, one for LineString and one for Polygon. Under additional parameters, make sure to specify EPSG:3006 – SWEREF99 TM, which is the official projection for Sweden. There are more localized projections too, but this is the standard for Sweden if no particular region is selected. If you work outside of Sweden and are unsure about what reference system and projection to use, you can always use the most common global system, the World Geodetic System (WGS) WGS84 (EPSG:4326).
Depending on the purpose of the vector layers, you can add fields and define data types. In our example, we assume that we want to use the files to map our findings from field work. Add fields according to the example in Figure 1. You can always add and remove fields later. Add the length field only for the line layer and the area field only for the polygon layer.
Drag and drop or double click the layers in the Browser to add them to the map. Right click one of the layers and choose Toggle Editing to make the layer editable. You can add features to your shapefiles on the map using the Digitizing Toolbar.

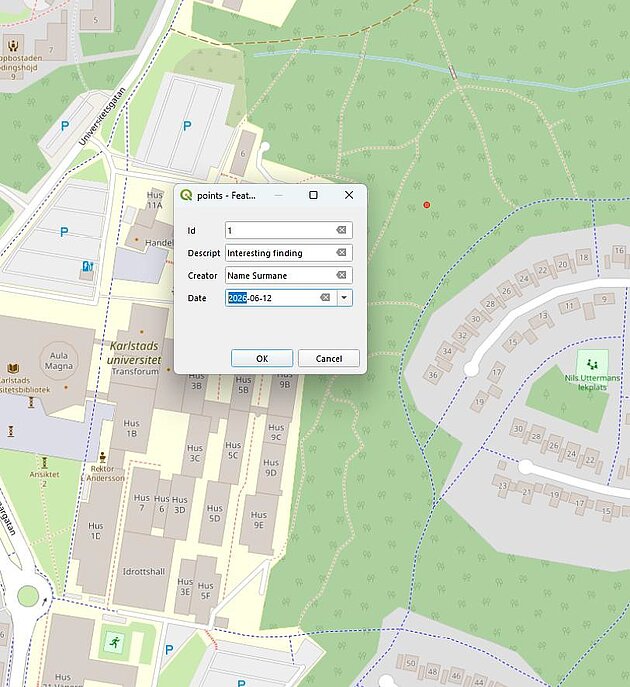
Click on the map and add new features and add information as in the example in Figure 2. When you are done, save your edits. Create at least one feature
Now we calculate the length of the created line and area of the created polygon using the Field Calculator.

Open the attribute table of your vector layers (right click and Open Attribute Table) and ensure that Toggle Editing is enabled.

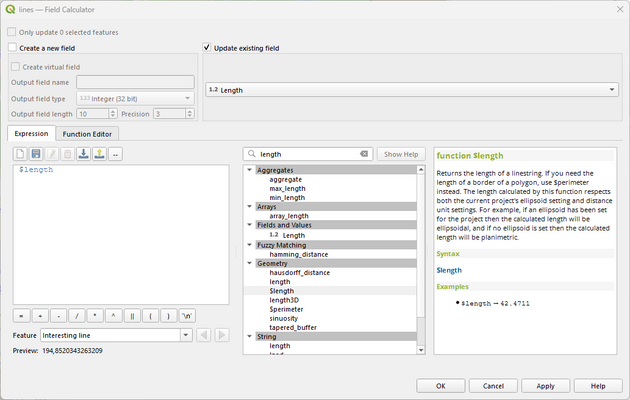
Open the Field calculator and calculate length for lines according to the example in Figure 3. For polygons, replace $length with $area.
2. Create raster data in QGIS from ASCII format
The need for creating raster data based on your collected/created data is less common as raster surfaces predominately represent continuous surfaces over large-scale phenomena, e.g. elevation, temperature or precipitation distributions. However, if you need to create raster data, you can do this relatively straight-forward based on point data representing numerical observations already in vector format thorough interpolation or by creating raster data in tabular form. In this example, we will create an ASCII-text file and import it to QGIS.
An ASCII raster file stores raster data as plain text. It has two parts: a header and a grid of cell values. The header defines the raster:
Ncols | 10 | number of columns |
nrows | 10 | number of rows |
xllcorner | 419430 | x-coordinate of lower-left corner |
yllcorner | 6586100 | y-coordinate of lower-left corner |
cellsize | 50 | cell size in metres |
NODATA_value | -9999 | value formissing data |
The values below the header represent raster cells, row by row, usually from the top row to the bottom row. Each value could represent elevation, temperature, land cover class, flood depth, suitability score, etc. Copy the following ASCII code over to a new textfile and rename the file from raster.txt to raster.asc.
ncols | 10 |
nrows | 10 |
xllcorner | 419430 |
yllcorner | 6586100 |
cellsize | 50 |
NODATA_value | -9999 |
10 11 12 13 14 15 16 17 18 19
12 13 14 15 16 17 18 19 20 21
14 15 16 17 18 19 20 21 22 23
16 17 18 24 25 26 27 23 24 25
18 19 20 26 27 28 29 25 26 27
20 21 22 28 29 30 31 27 28 29
22 23 24 30 31 32 33 29 30 31
24 25 26 27 28 29 30 31 32 33
26 27 28 29 30 31 32 33 34 35
28 29 30 31 32 33 34 35 36 37
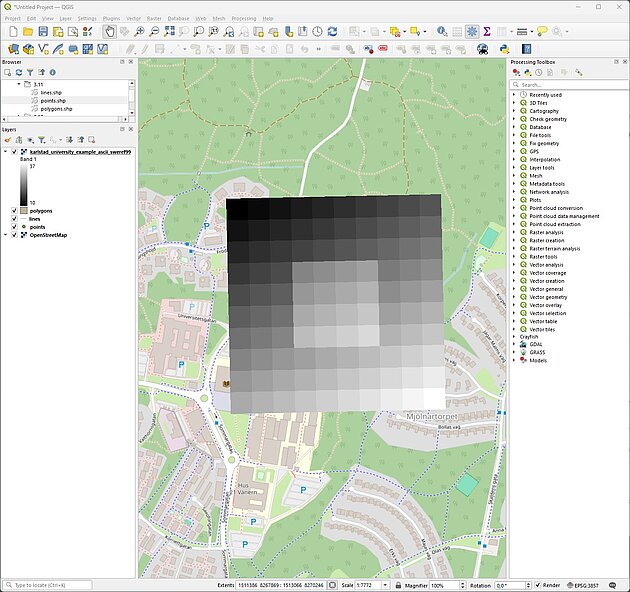
Drag and drop the file to your map in QGIS. Right click on the new file and Zoom to layer(s). You will notice that the raster is not located over Karlstad university where it should be. This is because the program has no information about the coordinate system in the file. We need to define this first. Right click the file again and select Properties. Under the Source section, choose EPSG:3006 – SWEREF99 TM as Assigned Coordinate Reference System (CRS). Zoom to the layer once more. If everything went well, you should now see your raster similar to the one in Figure 4.
The ASCII-format is convenient for storing and sharing raster data (system independent and storage efficient). On the other hand, capabilities for analyzing and transforming raster data are limited. To that end, it is better to store the data as GeoTIFF for further operations. To do this, right click on the file name in the Layers window and select Export > Save As. Give the file an appropriate name and save it (keep everything else default).
3. Import tabular data in CSV format to QGIS
Sometimes, you have data over objects (e.g. observations, findings) stored in databases outside of a GIS. It is possible to import the data to a GIS given each entry has valid coordinates in an established system. Several tabular data formats can be imported. In this exercise, we start by creating our own CSV file. Create a file in a text editor or e.g. MS Excel containing the following 11 lines and save/export as example.csv.
id,name,x_sweref99,y_sweref99,description 1,Point_01,419490,6586260,Example point near campus 2,Point_02,419560,6586320,Example point near campus 3,Point_03,419640,6586290,Example point near campus 4,Point_04,419710,6586210,Example point near campus 5,Point_05,419600,6586150,Example point near campus 6,Point_06,419430,6586170,Example point near campus 7,Point_07,419350,6586240,Example point near campus 8,Point_08,419470,6586380,Example point near campus 9,Point_09,419680,6586400,Example point near campus 10,Point_10,419780,6586320,Example point near campus
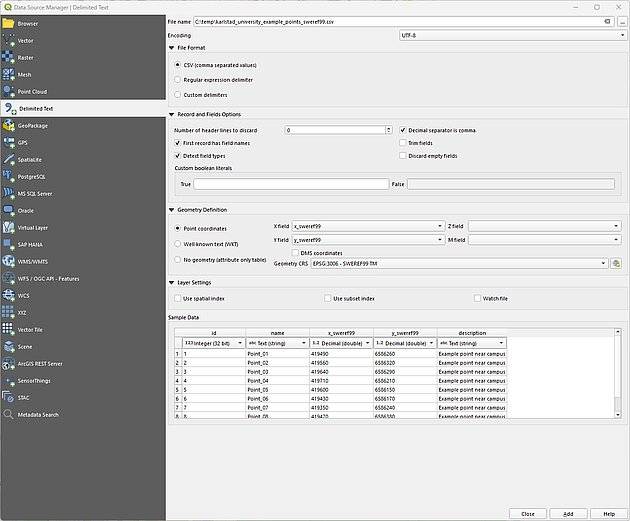
The first line is the header and describes the nature and content of the ensuing rows. A header is needed for the program and data users to understand the content of the data and for correct coordinate interpretation. Go to QGIS and open the CSV Import Tool by selecting Layer > Add Layer > Add Delimited Text Layer. Browse to your .csv file and choose the right file format and settings according to Figure 5 and click on Add. Ten new points have been added to the map.
Reference
ASCII raster format
The ASCII raster format (often called ESRI ASCII Grid) is a simple text-based file format used to store raster data in GIS. The format represents a raster as a grid of rows and columns, where each cell contains a numeric value describing a geographic attribute such as elevation, temperature, land cover or flood depth. Because the file is stored as plain text, it can be viewed and edited with a standard text editor. An ASCII raster file consists of a header, which defines the raster's dimensions, location, cell size, and NoData value, followed by the grid cell values arranged row by row. Although ASCII files are easy to exchange between different GIS software packages and are human-readable, they are generally slower to process than binary raster formats such as GeoTIFF. ASCII raster files are widely used for sharing digital elevation models (DEMs), interpolation results, environmental models, and other gridded spatial datasets between GIS applications.
CSV (Comma-Separated Values)
CSV is a simple text-based file format used to store tabular data. Data are organized into rows and columns, with each row representing a record and each column representing an attribute. Values are typically separated by commas, although other delimiters such as semicolons may also be used depending on regional settings. CSV files are widely used because they are easy to create, read, and exchange between different software applications, including spreadsheets, databases, and GIS programs. In GIS, CSV files are commonly used to import point data containing coordinates, such as GPS measurements, survey observations, and environmental monitoring data.
QGIS
QGIS (Quantum Geographic Information System) is a free and open-source Geographic Information System (GIS) software used for creating, managing, analyzing, and visualizing spatial data. It supports a wide range of vector, raster, and web-based geospatial data formats and provides powerful tools for cartography, spatial analysis, remote sensing, and geoprocessing. QGIS is widely used in academia, government agencies, and industry for applications such as environmental monitoring, urban planning, natural resource management, and disaster risk assessment. Its extensible plugin ecosystem and integration with programming languages such as Python make it a versatile platform for advanced geospatial workflows.
Raster data
Raster data is a GIS data model that represents geographic information as a grid of equally sized cells (pixels), where each cell stores a value describing a characteristic of the Earth's surface. Raster data is commonly used for continuous phenomena such as elevation, temperature, precipitation, land cover, and satellite imagery. The spatial resolution of a raster is determined by the size of its cells, with smaller cells providing more detailed information but requiring more storage and processing power. Raster data is particularly well suited for spatial analysis, modelling, and remote sensing applications.
SWEREF 99
The Swedish Reference Frame 1999 (SWEREF99) is the national geodetic reference system used in Sweden for mapping, surveying, GIS, and navigation. It is based on the European terrestrial reference system ETRS89 and provides a consistent coordinate framework across the country. SWEREF 99 was officially adopted by Swedish authorities in 2007, replacing the older RT90 coordinate system. The most used projection is SWEREF 99 TM (EPSG:3006), a Transverse Mercator projection designed to cover all of Sweden with a single coordinate system. Coordinates are expressed in metres, making them suitable for accurate distance, area, and spatial analyses. In addition to SWEREF 99 TM, twelve local projection zones are available to minimize distortions in regional applications. Today, SWEREF 99 serves as the standard coordinate reference system for Swedish geospatial data and is used by organizations such as the Lantmäteriet, municipalities, government agencies, researchers, and private companies. It is fully compatible with modern GNSS/GPS measurements and forms the basis for most spatial datasets in Sweden.
Vector data
In GIS, vector data and raster data represent two fundamental models for storing and analyzing geographic information. Vector data represents discrete geographic features using points, lines, and polygons. Examples include buildings, roads, property boundaries, and administrative regions. Each feature can be linked to attribute information stored in a table, such as names, categories, or measurements. In contrast, raster data represents geographic phenomena as a grid of cells (pixels), where each cell contains a value. Raster data is commonly used for continuous surfaces such as elevation, temperature, land cover, or satellite imagery. Vector data is generally more suitable for representing clearly defined objects with precise boundaries, while raster data is better suited for continuous environmental variables and image-based analyses. Many GIS workflows combine both data types, for example by analyzing how land cover derived from raster imagery affects vector features such as properties, roads, or protected areas.
WGS 84 (World Geodetic System 1984)
The WGS 84 is the global coordinate reference system used by GPS and most web mapping applications. It defines locations on the Earth's surface using geographic coordinates expressed as latitude and longitude. WGS 84 provides a common worldwide reference framework, enabling accurate positioning and navigation across countries and continents. In GIS, it is commonly identified by EPSG:4326 and is widely used for GPS data, online maps, and global spatial datasets.